Hybidization Technology
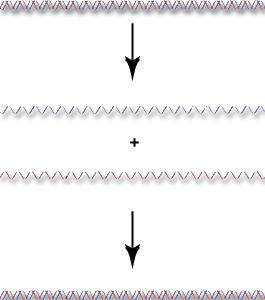
Renaturing Nucleic Acids
As a result, the rate at which double-stranded DNA molecules denature is independant of DNA concentration.
In contrast, the reannealing of two single strands is a bi-molecular reaction.
Two complementary single strands
must meet one another
and then complementary base pairs form between the two strands.
Because this is a bi-molecular reaction, the rate of the reaction depends on the concentration of the reactants - the two complementary strands.
Because reannealing is a bimolecular reaction, we are primarily interested in the rate at which the reaction occurs.
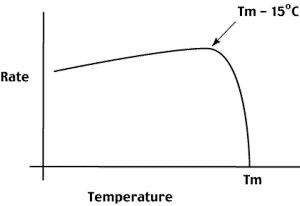
Reannealing reaction conditions are therefore chosen to MAXIMIZE the rate at which hybrids form.
The curve to the right shows how the rate of reannealing depends on temperature.
To maximize the rate of reannealing, we typically hybridize 15 oC below the Tm of the hybrid. Hybridization is also done at high salt to minimize the repulsion of the
sugar-phosphate backbones.
In order to visualize this concept, consider the reannealing of a variety of DNA samples.
To standardize conditions,
each DNA sample is sheared to random fragments 500 bp long.
Each DNA sample is at the same DNA (50 ug/ml) and NaCl concentration(1M).
Each sample is heated to boiling to denature it and then held at (Tm-15 oC) while the amount of DNA remaining single stranded is monitored.
The % single stranded is graphed as a function of
Cot - the initial DNA concentration (Co) times time (t)
Since the reaction follows bimolecular kinetics, we can obtain a value
Cot1/2 = Cot at which 1/2 of the DNA has reannealed
Cot1/2 measures the rate of reannealing which is inversely proportional to the concentration of complementary sequences being examined.
Small Cot1/2 values indicate that the complementary sequences are at high concentration.
(they reanneal very quickly, t is small)
Large Cot1/2 values indicate that the complementary sequences are at low concentration.
(they reanneal very slowly, t is large)
The following examples are ment to illustrate "Cot analysis (good luck)
The DNA reanneals as a single kinetic component (a single sigmoidal curve)
The midpoint of the curve provides the value for Cot1/2 - the time required for half of the single strands to be in double stranded form at a defined initial DNA concentration.
In contrast to the above example, the E. coli genome consists of 5,000,000 bp of unique sequence.
Again, plotting the % single stranded as a function of Cot, we observe a single sigmoidal curve confirming that the E coli genome reanneals as a single kinetic class.
Notice that the Cot curve has shifted to the right relative to the lambda Cot curve. The increase in Cot1/2 reflects the number of copies of the E coli genome in solution as compared to the lambda genome. Since the E coli genome is 2 orders of magnitude larger than the lambda genome, any given 500 bp fragment will be present at 100 x lower concentration in the E coli genome sample.
This can be illustrated by considering what happens when the DNA sample consists of equal mass amounts of the lambda and E coli genomes (each at 25 ug/ml)
The Cot curve now has two kinetic components,
each comprising about 1/2 of the total DNA in the sample,
one with a Cot1/2 of the lambda genome,
one with a Cot1/2 of the E coli genome.
What about eukaryotes? What does the reannealing of eukaryotic genomes look like?
Unlike most prokaryotes, the Cot curves of eukaryotic genomes are complex curves. Modeling based on bimolecular kinetics allows us to 'fit' the data to define three kinetic classes that differ in their repetition frequency in the genome.
The first class represents a small portion of the genome (typically 10% or so) but is very highly repeated (10,000s of copies). These are short highly clustered repeated sequences found at eukaryotic telomeres and centromeres. Dispersed copies of these simple sequence repeats are also common.
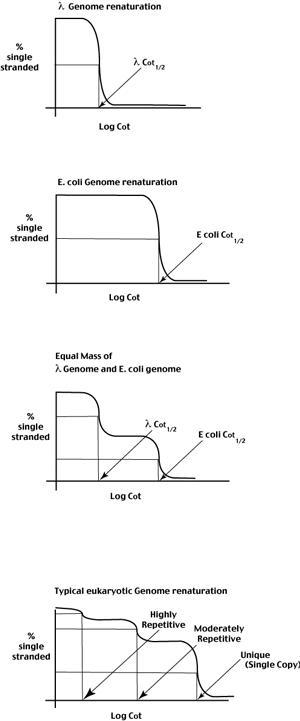
The third kinetic class is the unique sequence of the genome. In this class we find most the the protein coding sequences of the genome. This class typically contains the majority of the sequence in the eukaryotic genome.
Manipulation of Hybrid Stability